With more and more data being collected, modern network representations exploit the complementary nature of different data sources as well as similarities across patients. We here introduce the Variation of information fused Layers of Networks algorithm (ViLoN), a novel network-based approach for the integration of multiple molecular profiles. As a key innovation, it directly incorporates prior functional knowledge (KEGG, GO). In the constructed network of patients, patients are represented by networks of pathways, comprising genes that are linked by common functions and joint regulation in the disease. Patient stratification remains a key challenge both in the clinic and for research on disease mechanisms and treatments. We thus validated ViLoN for patient stratification on multiple data type combinations (gene expression, methylation, copy number), showing substantial improvements and consistently competitive performance for all. Notably, the incorporation of prior functional knowledge was critical for good results in the smaller cohorts (rectum adenocarcinoma: 90, esophageal carcinoma: 180), where alternative methods failed.
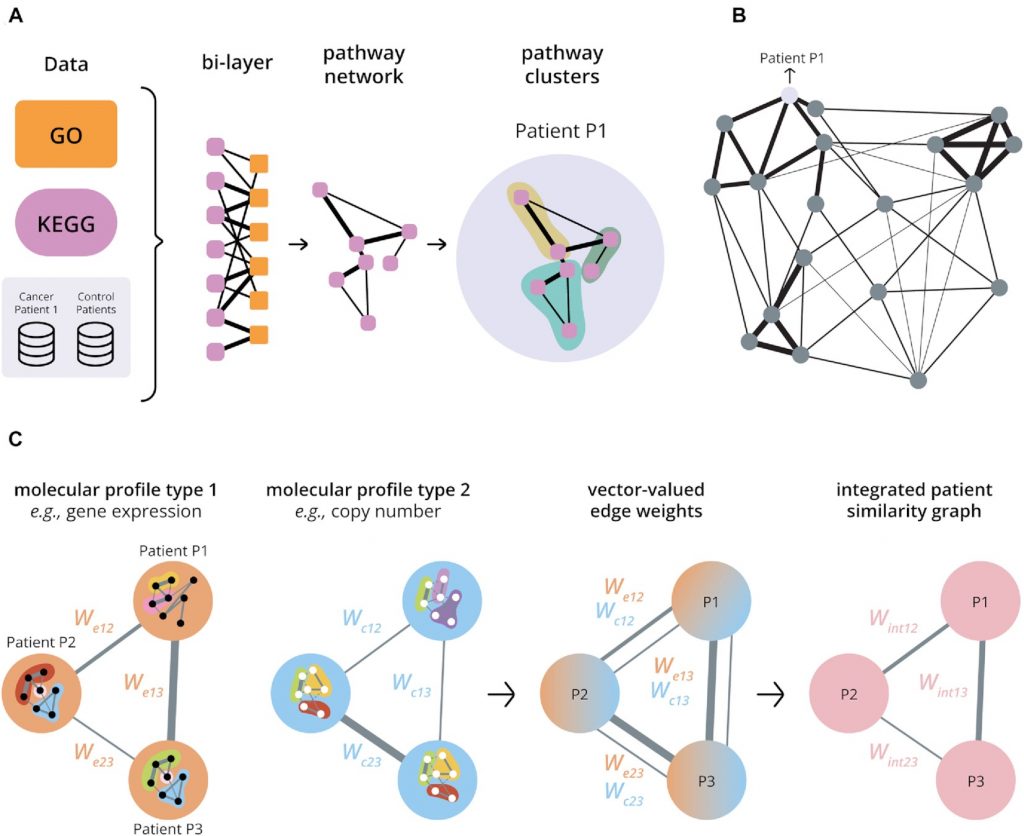
Overview of the multi-layer network structures exploited by the novel algorithm. (A) Building a patient-specific pathway network from a single molecular profile type that integrates functional knowledge. A patient-specific disease profile (‘Cancer Patient 1’) is compared to controls (‘Control Patients’). The resulting differential effect (e.g. differential expression) is then assessed for genes of known biological processes (GO, orange) in a range of KEGG pathways (lavender). We next construct a bi-layer network with one layer of nodes representing KEGG pathways (lavender) and one layer of nodes representing biological processes (GO, orange). The overlap of genes between an orange and a lavender node (Jaccard Index) and the median posterior probability of a differential effect of these genes determine the edge weight (see Methods). This links pathways through their common functions in the cell in the context of the patient’s disease. After integrating the bi-layer network by summation, each patient is thus represented by a network of KEGG pathways connected by weighted edges that reflect the similarities between pathways in the context of the patient’s disease. The robust pathway clusters identified by a stochastic block model (shown in three colours for Patient P1) can be used as a characteristic fingerprint. Weights are illustrated by black lines with thickness representing weight strength (see Supplementary Figure S8 for details). (B) Building a patient similarity graph from a single molecular profile type using pathway clusters. The set of pathway clusters for a patient can be used to characterize the disease of that patient as reflected in a particular molecular profile type and already incorporating functional knowledge (A). The variation of information distance between the clusterings for different patients then forms a natural measure of patient differences, yielding a Variation of Information metric. Constructing a network of patients based on this metric thus allows an exploration of similarities between patients in the context of the disease. Nodes in the patient similarity graph represent patients and edge weights reflect pairwise similarities. The thicker a connecting edge, the stronger the similarity. (The figure omits some connections for visual clarity.) (C) Integrating multiple molecular profile types. A patient similarity graph is first constructed for each molecular profile type (cf. B). Nodes in the graph represent patients, and edge weights reflect the patient similarities for each molecular profile type. The graphs for different molecular profile types can be superimposed to give one graph with vector-valued weights for edges between patient nodes. An integrated patient similarity graph is then obtained by combining the information across molecular profile types for edges reflecting an average patient similarity (see Materials and Methods).